When Hurricane Florence hit North Carolina in September 2018, its impacts were devastating and many communities were faced with food insecurity. Nonprofits across the state quickly initiated or increased relief efforts to affected areas. Among these was the Food Bank of Central & Eastern North Carolina, which had previously collected data regarding distribution amounts, poverty rates, and county populations. With that data, Vice President of Operations & Programs Charlie Hale wanted to understand the effectiveness of the Food Bank’s relief efforts and identify opportunities for improvement in response to future crises.
 With this goal in mind, Hale contacted Dr. Christopher Healey, Goodnight Distinguished Professor at the Institute for Advanced Analytics. Healey create a set of data visualizations to help the Food Bank team gain specific insights into its relief efforts. The visualizations can be viewed at https://www.csc2.ncsu.edu/faculty/healey/foodbank/. Read on to learn more about this project.
What was the impact of Hurricane Florence on the Food Bank? What measures were taken after the hurricane?
Hale: Hurricane Florence was a bellwether event for the Food Bank of Central & Eastern North Carolina. A year ago the Food Bank was in the midst of what would be the largest disaster relief effort in the organization’s 38-year history. By the time the fiscal year would end in June 2019, nearly 12.5 million meals (about 15 million pounds of food), 3 times the amount of food provided after Hurricane Floyd in 1999, would be provided to communities affected by the relentless flooding of Florence.
The Food Bank has 6 distribution centers across the state including locations in Durham, Raleigh (headquarters), Greenville, New Bern, Southern Pines, and Wilmington. Our relief efforts would directly impact all of these locations except Durham, with New Bern and Wilmington hit particularly hard. Even with the Food Bank’s expansive logistics capabilities, additional resources were required as food insecurity would continue across our 34-county service area even if the county was not impacted by the hurricane. Donated off-site warehouses were secured in Raleigh, New Bern, and Wilmington (two of which we still occupy today); Feeding America members across the nation sent staff (forklift operators, CDL truck drivers, inventory specialists, volunteer coordinators, etc.) to support the relief efforts; and communities donated food, time in volunteering, and money.
What prompted you to seek Dr. Healey’s help with visualizing the data you had already collected?
Hale: As the sustained relief efforts peaked and began to subside a bit, we began to ask ourselves questions like how well had we responded and what impact had this effort had on the community and our staff. We wanted to understand in retrospect, but still somewhat in time, what we had learned and how we could improve our efforts. We also knew we were generating detailed information about where, what, how much, and to whom the emergency food was going. I knew the Institute had helped the Food Bank in the past and was always at the ready when we had questions. So I reached out to Dr. Healey, who I had worked with a few years ago.
Can you elaborate on the purpose of each visualization?
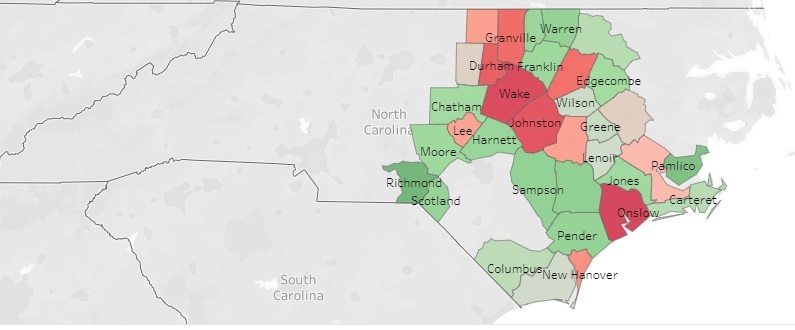
Hale: Initially, we thought the difference between normal food distribution levels and expanded disaster relief food distribution levels by county would show up really nicely in heat maps of each county. However, when we looked at the differences it wasn’t as resounding as expected. Instead, a visualization of how much of the emergency food flowing through our supply chain had become dedicated to disaster relief efforts related to Hurricane Florence was a far better visual. This showed a mountain of disaster relief food flowing through our supply chain, primarily via the New Bern and Wilmington branches.
How will the Food Bank utilize the maps that Dr. Healey created? What impact do you foresee with the insights gained from these visualizations?
Hale: The visualizations have helped the Food Bank review our disaster response efforts, take note of the areas where additional resources were needed, and identify in detail those additional needs. All of this will help the organization’s Emergency Action Team update our disaster relief plan and be even better prepared the next time a disaster affects our 34-county service area in Central & Eastern North Carolina.
Data Column | Institute for Advanced Analytics
The Collaborative Blog for Students in the Master of Science in Analytics