Ggeconodist: Your Secret Weapon for Graphing

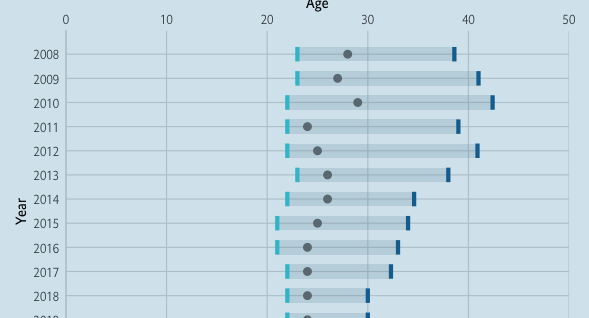
The  ggplot2 library is an incredibly powerful and wonderful visualization tool for most graphs, but when it comes to boxplots, the ggeconodist library has the upper hand. Learning to use this library in R means you will no longer spend 10 minutes explaining your boxplot to your audience. Both boxplots Continue reading Ggeconodist: Your Secret Weapon for Graphing

Learning SAS With Baseball Data, Where Process > Results

Last Monday marked the beginning of the “bootcamp” portion of the MSA program. Aside from two communications classes and preparing for a group presentation, the first week of bootcamp mainly consisted of learning and applying statistical concepts and the SAS programming language. As a member of the orange summer cohort, Continue reading Learning SAS With Baseball Data, Where Process > Results

Blood Sugar Analysis App

The ability for organizations to data mine and address a wide range of business problems across many industries is a huge asset in terms of ROI. What about big data and analytics helping not only the bottom line but also the general public? What about all the data that envelops Continue reading Blood Sugar Analysis App