Visualization and Analysis of the S&P 500 Index Fund

Inflation, Inflation, Inflation! With inflation soaring lately, it is hard not to ponder how to stay ahead of it and how to financially secure your future. As students embark on their analytics journey at the Institute for Advanced Analytics, a basic understanding of financial investing may help with investment goals Continue reading Visualization and Analysis of the S&P 500 Index Fund

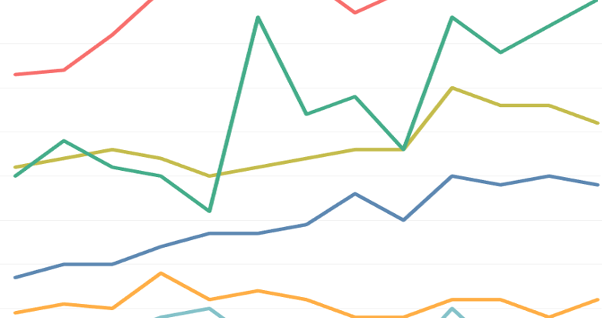
A Guide to Colorblind-Friendly Visualizations

multicolored line graph

At the Institute for Advanced Analytics, we spend a lot of time honing our communication skills. This surprised me at first. Coming from a background in statistics, I had always spent more time thinking about the tests I was running or the models I was building than the presentation of Continue reading A Guide to Colorblind-Friendly Visualizations

Datalines: An Interview with Maia Majumder

“Novel data streams allow us to see what’s happening in areas where traditional disease surveillance is weak. As internet penetration around the world improves, we are getting better signal in more places.” Maia Majumder is a computational epidemiology research fellow at HealthMap and a PhD candidate at MIT. In our Continue reading Datalines: An Interview with Maia Majumder